How to design experiments to test your assumption?
24 March 2021
Can you guarantee SUCCESS of a new idea? Nope. Nobody can. Not even GOD himself.
Don’t believe me – check this Google Graveyard and Microsoft Morgue – and see how many times these most competent companies fail.
According to the law of market failure, most new products will FAIL in the market, even if they are competently executed.
So is there anything you can do to prevent FAILURE of your idea? Yes, you can.
You can run EXPERIMENTS. They are the best way to reduce the RISK and UNCERTAINTY of a new idea.
In fact, experiments can give you the EVIDENCE required to decide whether an idea is worth pursuing.
Let’s start from the start:
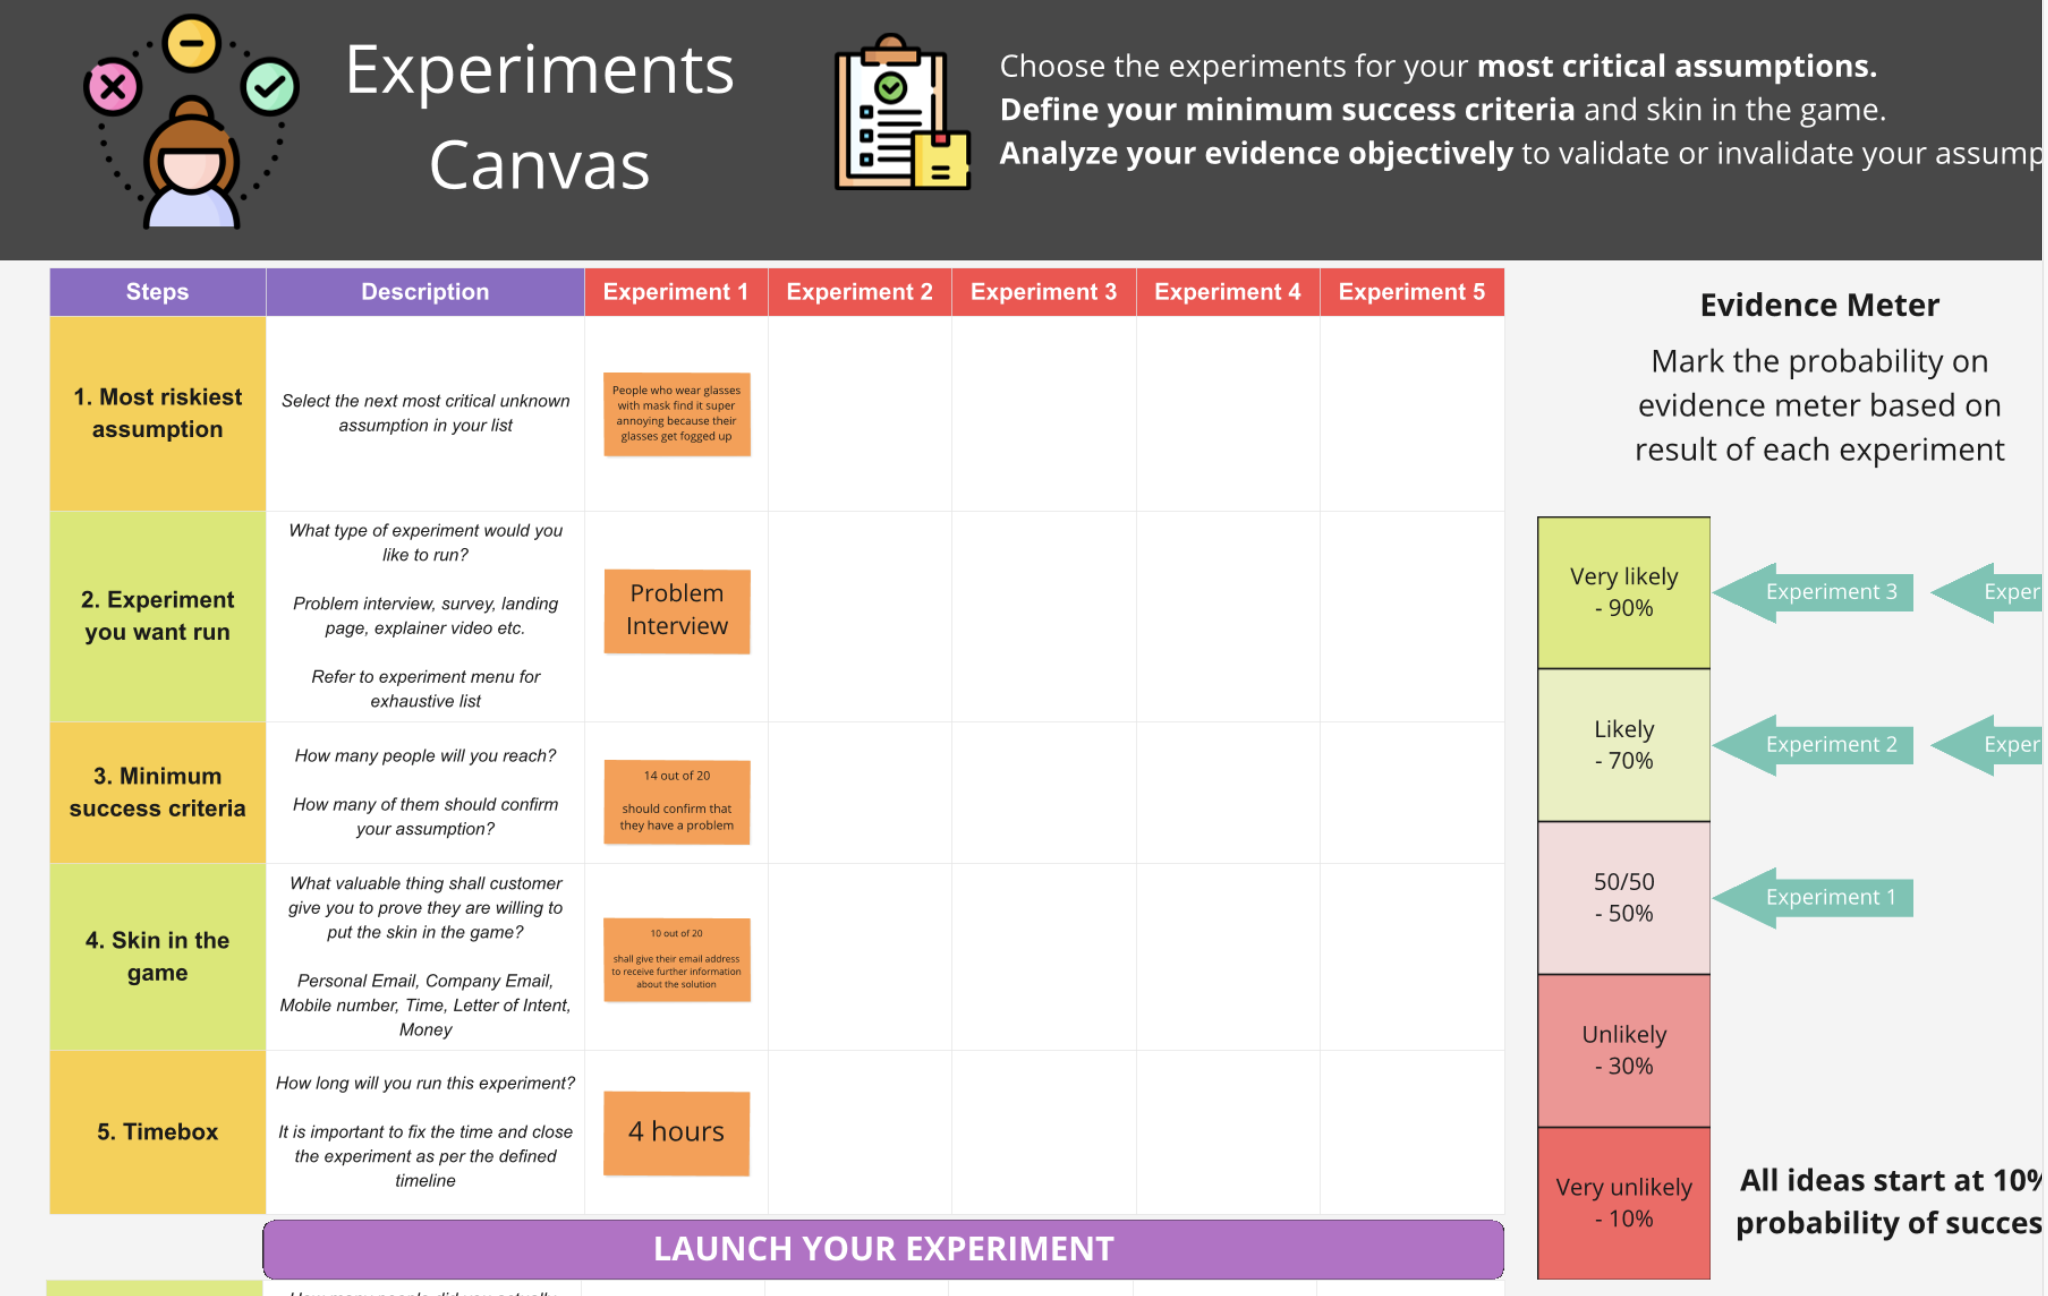
Here is the experiment canvas you can download for writing hypothesis and designing your experiments: Experiment Canvas
Step One: You’ve got an idea. It looks brilliant on a yellow sticky note.
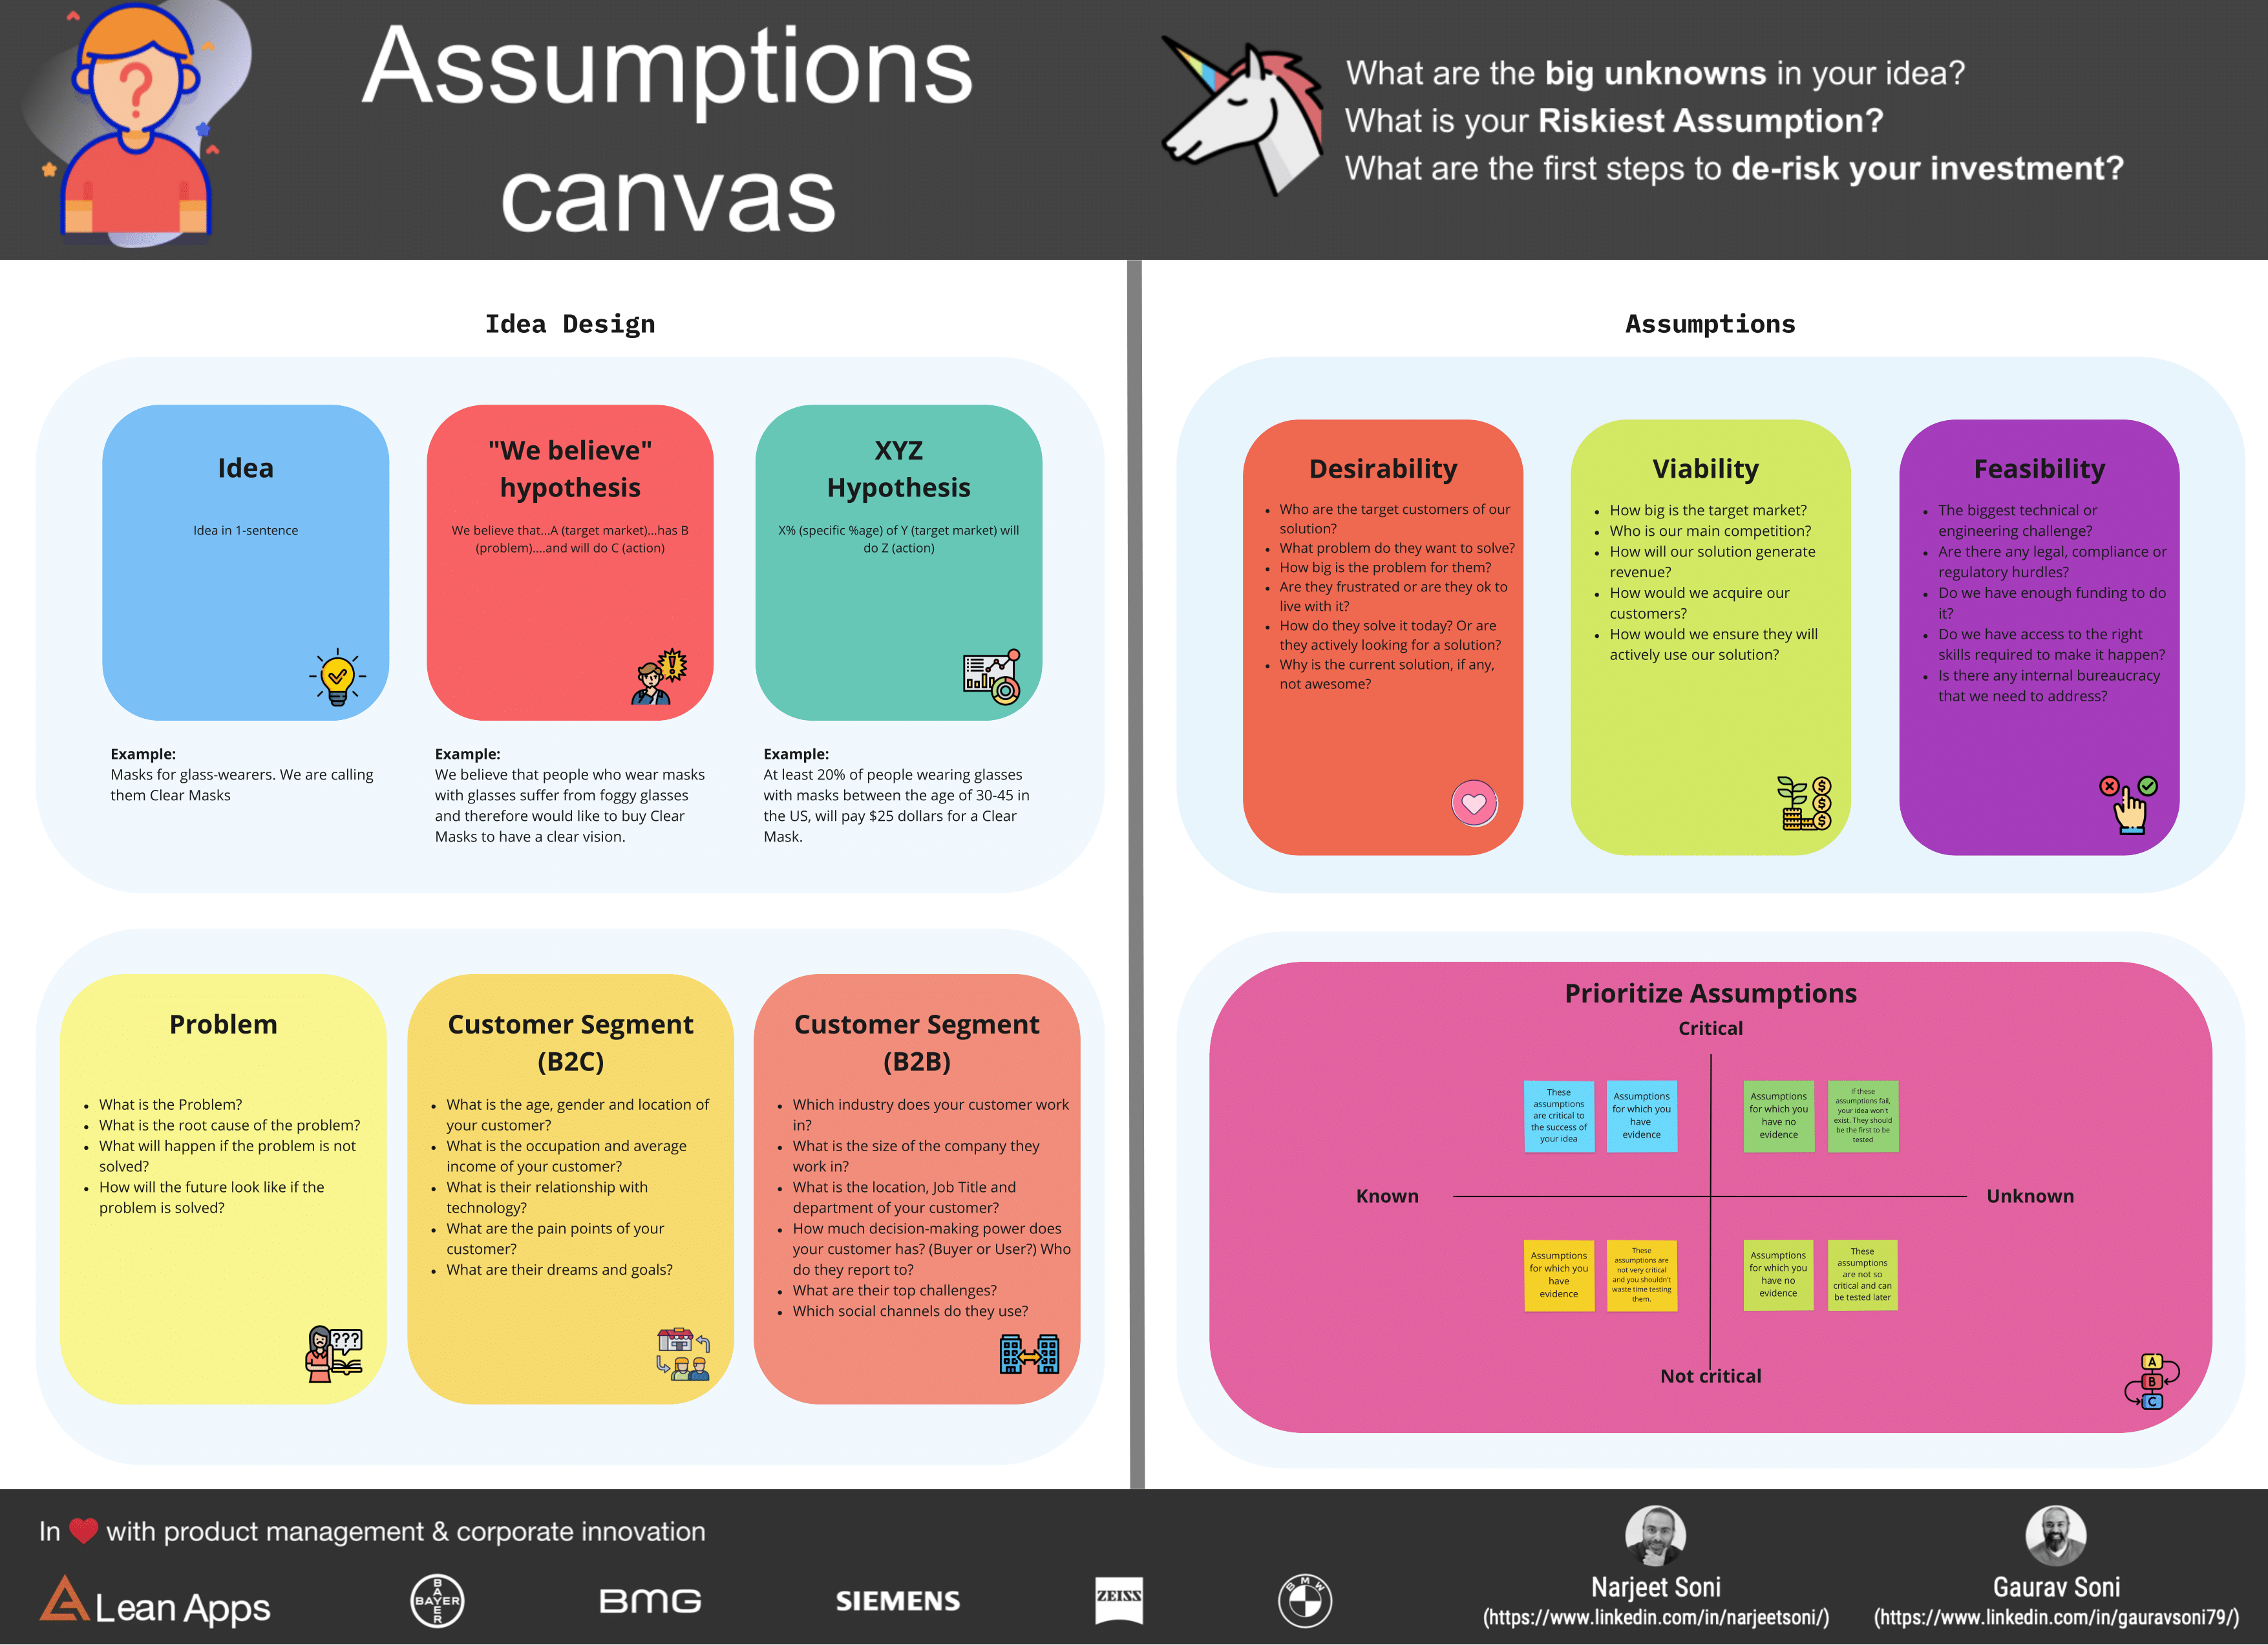
Step Two: You IDENTIFY all the assumptions (unknowns) in your idea. (Check out our last post)
Link to Assumption Canvas
Step Three: You turn all the assumptions underlying your idea into clear HYPOTHESES that you can test. (Check out our last post)
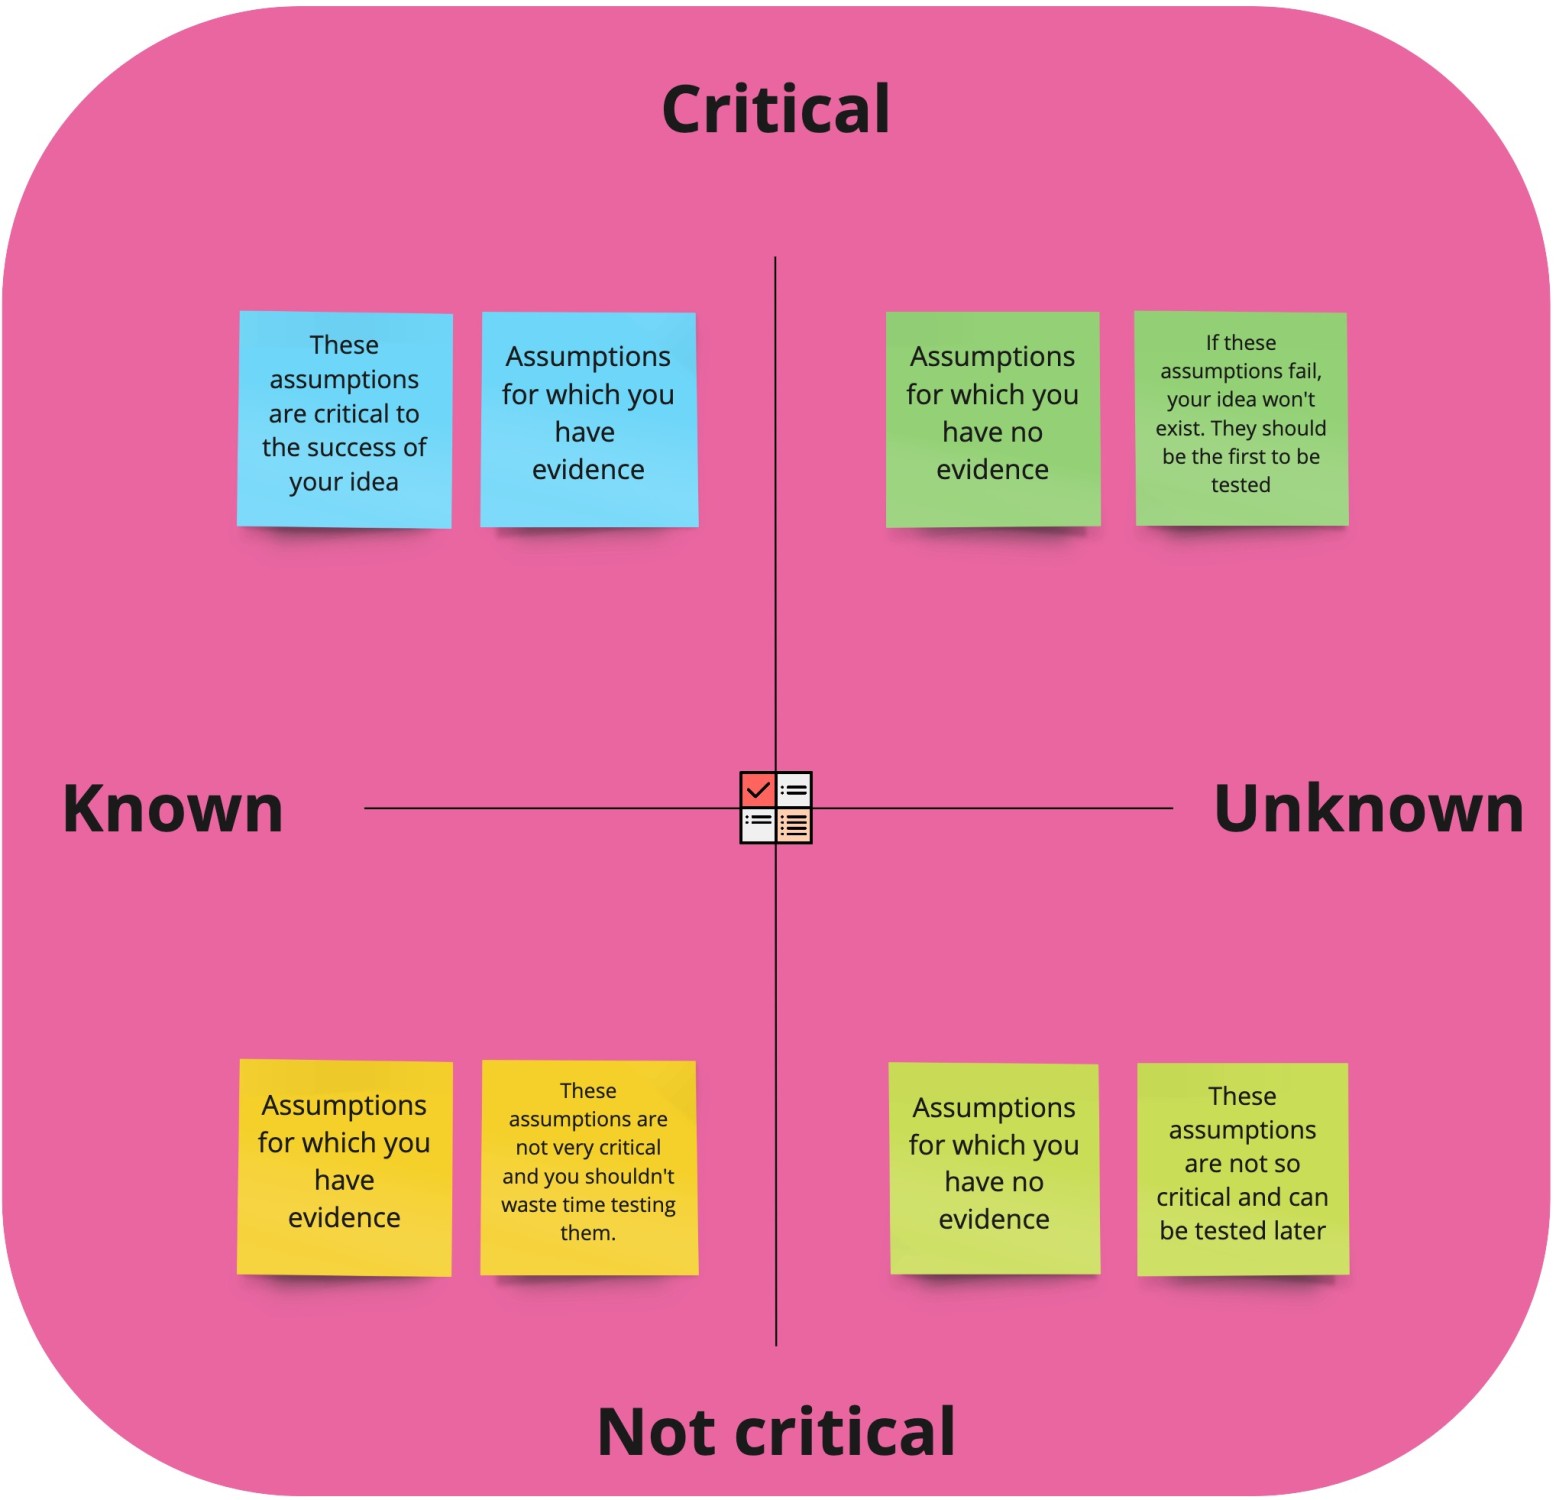
Step Four: You PRIORITIZE all your Assumptions with the help of the Assumption Mapping Exercise. (Check out our last post)
By now you will know the most critical unknowns in the idea. If you don’t validate them, they could KILL your complete idea.
Now what? Now you focus on running EXPERIMENTS to validate them one-by-one.
Start with turning your most critical unknown ASSUMPTION into an EXPERIMENT. And keep in mind that to learn quickly, you should try and go for cheap and fast experiments.
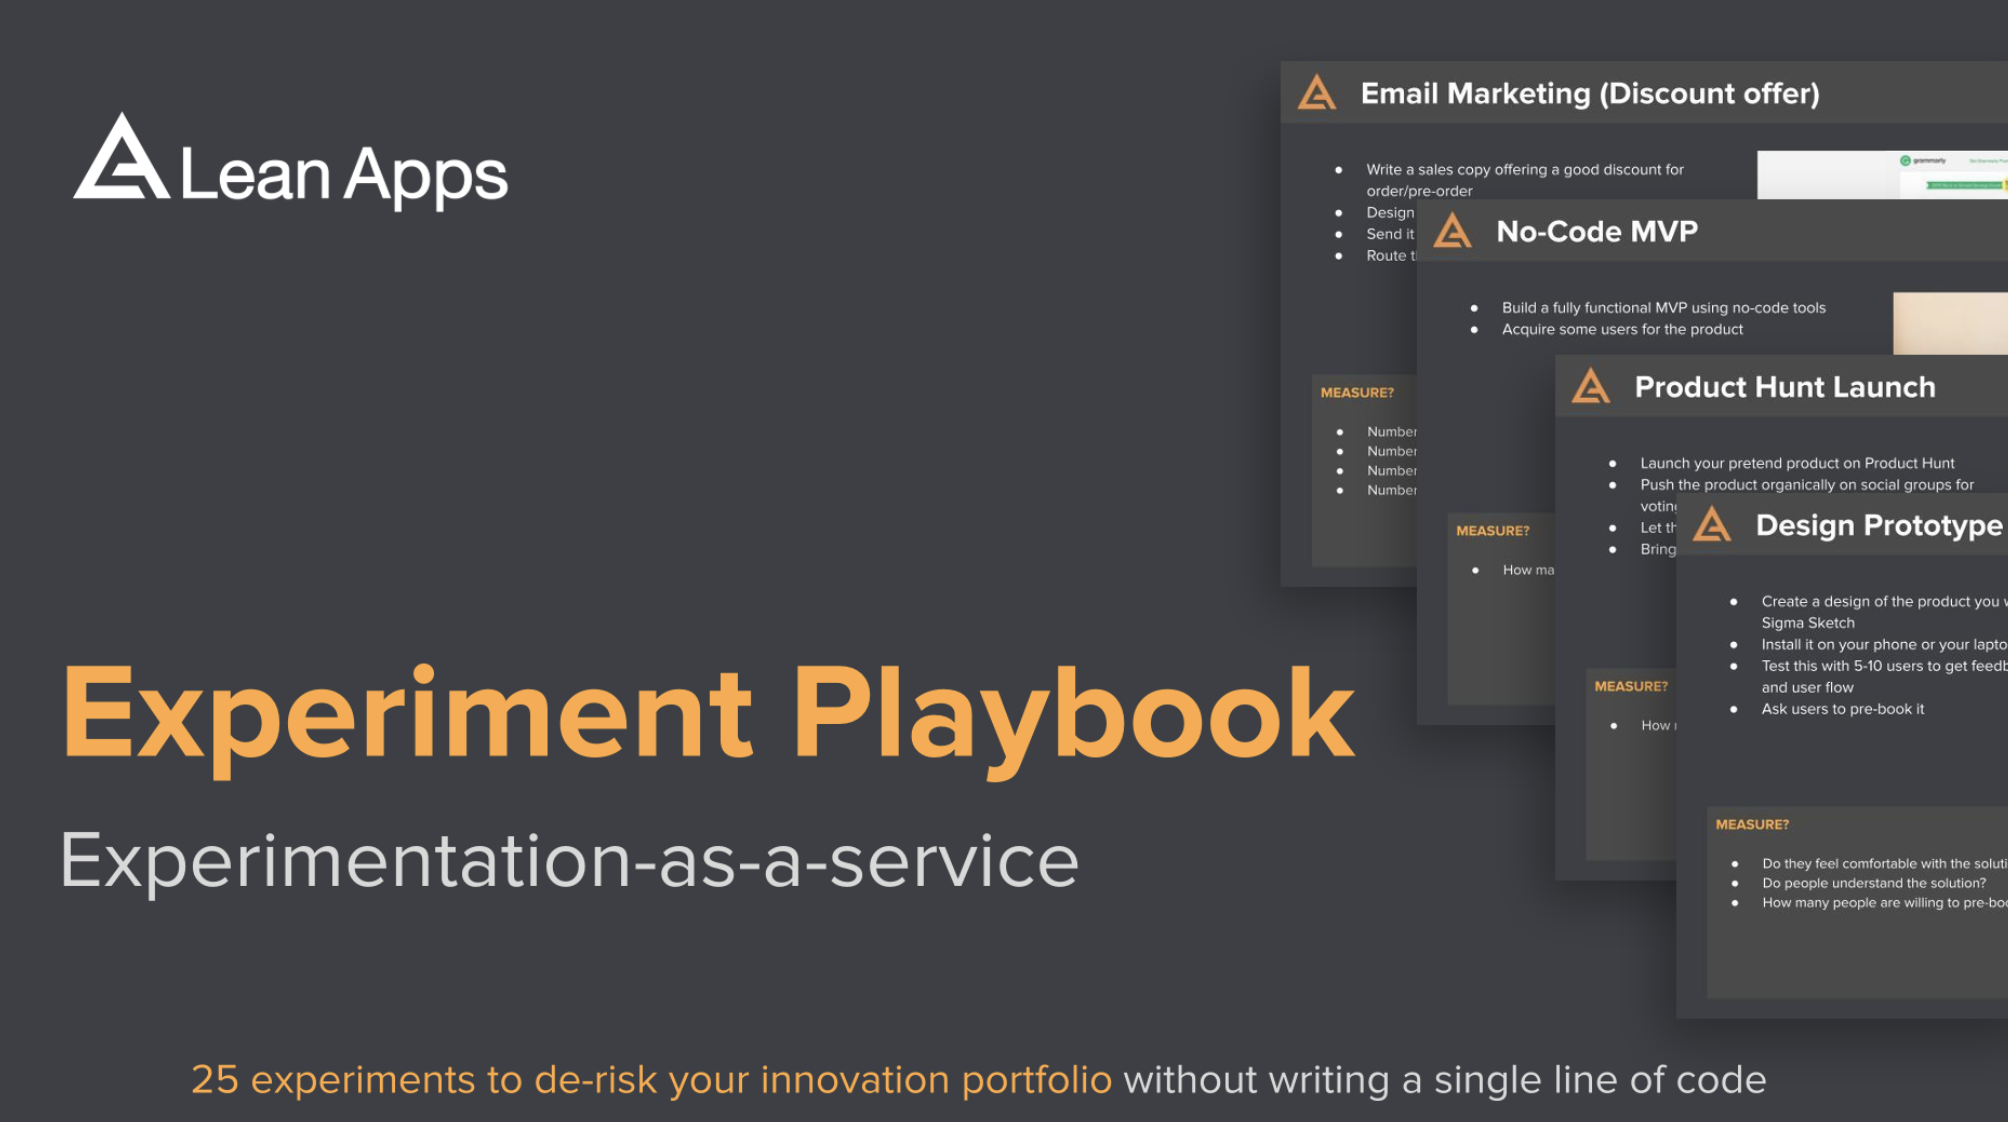
There’s a whole menu of experiments out there. Customer Interviews, Physical Brochures, Email Campaigns, Landing Pages, Customer Surveys, Online Ads, Tear-off Ads, Design Prototype etc.
Check our experiments menu to choose the right experiment.
How do you choose your EXPERIMENT?
You can choose your EXPERIMENT on the basis of:
(as explained in the right it by Alberto Savoia)
Hours to data: The faster, the better
Hours to data is a measure of how many hours it will take you to execute an experiment and collect some high quality evidence. The shorter the time-to-data, the better. You can typically set a limit of x hours, and offer bonus points if your team can get the evidence even more quickly
Tip: think in terms of hours, rather than days or weeks.
Cost to data: The cheaper, the better
Most new ideas for new products can be properly tested with very little money — some with virtually no money. It could be pizza for the team lunch or doughnuts breakfast. Come up with the cheapest way to test your idea that does not sacrifice evidence quality.
Distance to data: The shorter, the better
If you plan to collect your data in the physical world (eg: at a store, on a street corner, or in a club meeting), you can measure distance to data using your favorite unit for distance (eg: miles, kilometers, yards etc) and then try to minimize it. By keeping initial market validation efforts as local as possible, you save valuable time and money, which allows you to run more experiments or test more ideas. When your product idea allows it to be marketed, acquired, or tested online, you can replace units of physical distance with virtual ones such as emails, web posts, or web pages. Instead of counting physical steps, you count digital steps. It’s easier than you think. Eg: three digital steps could be
- Writing one email to the forum
- Writing one post to introduce your product
- Creating a basic website with one landing page to collect some skin in the game (emails, deposits etc.) from potential customers
What is Skin in the game?
If your customer doesn’t have anything to lose or gain with respect to your idea, it means he/she has no skin in the game. It doesn’t have to be an investment of $100 in your idea to count as skin in the game.
Initially it could be as little as a VALID email address (company email is even better) or a phone number from a customer. Anything that your customers value and are willing to part with is considered skin in the game. Later, it could also be their time spent with you to get a product demo or the money they commit to you as a pre-order of your product.
It has to be something more than just an opinion. Remember
“It’s easy to get people to open their mouths, but not their wallets.”
What is a good EXPERIMENT anyway?
A good experiment is one that generates strongest evidence in the fastest way and smallest cost.
A good experiment has 5 important ingredients:
- Assumption: A risk that is made explicit in the form of a critical hypothesis.
We believe that..(people who wear glasses would like to have special masks that do not fog their glasses)
2. Experiment: A description of the experiment you will run to validate or invalidate the assumption.
To verify that, we will.. (interview people who wear glasses in our neighborhood and ask for their email addresses)
3. Metrics: The exact data you will measure as part of your experiment.
And measure (ask 20 people who wear glasses in our neighborhood for their email addresses)
4. Time Box: The amount of time you spend in running an experiment to generate sufficient evidence.
For how long.. (4 Hours, 1 day, 1 week)
5. Minimum Success Criteria: The metric you use for your experiment to be validated.
We are right if.. (50% of the people will be frustrated due to foggy glasses and at least 30% of the people we talk to will give us their email addresses)
What do you do with the EVIDENCE you’ve gathered?
Well, sadly evidence doesn’t speak on its own. That’s why you need to ANALYSE it by asking key questions such as:
- What was the ACTUAL REACH of your experiment? You might have set out to interview 20 target customers in 5 hours. But perhaps, you only got through 12.
- Do you have STRONG or WEAK evidence?
- How MANY of your target customers VALIDATED or INVALIDATED the assumption you were testing?
The answers to these questions will give you quantitative INSIGHTS.
You’ll also be able to gather qualitative INSIGHTS by observing your customers’ behavior and opinions.
For example, customers might describe a new problem that you are not aware of, or they might use a new vocabulary or specific phrases to describe a problem, or their body language might tell you whether they feel enthusiastic about your product etc.
All this will give you an understanding into how likely your idea will work. And this in turn will help you make informed decisions.
Next step would be to..
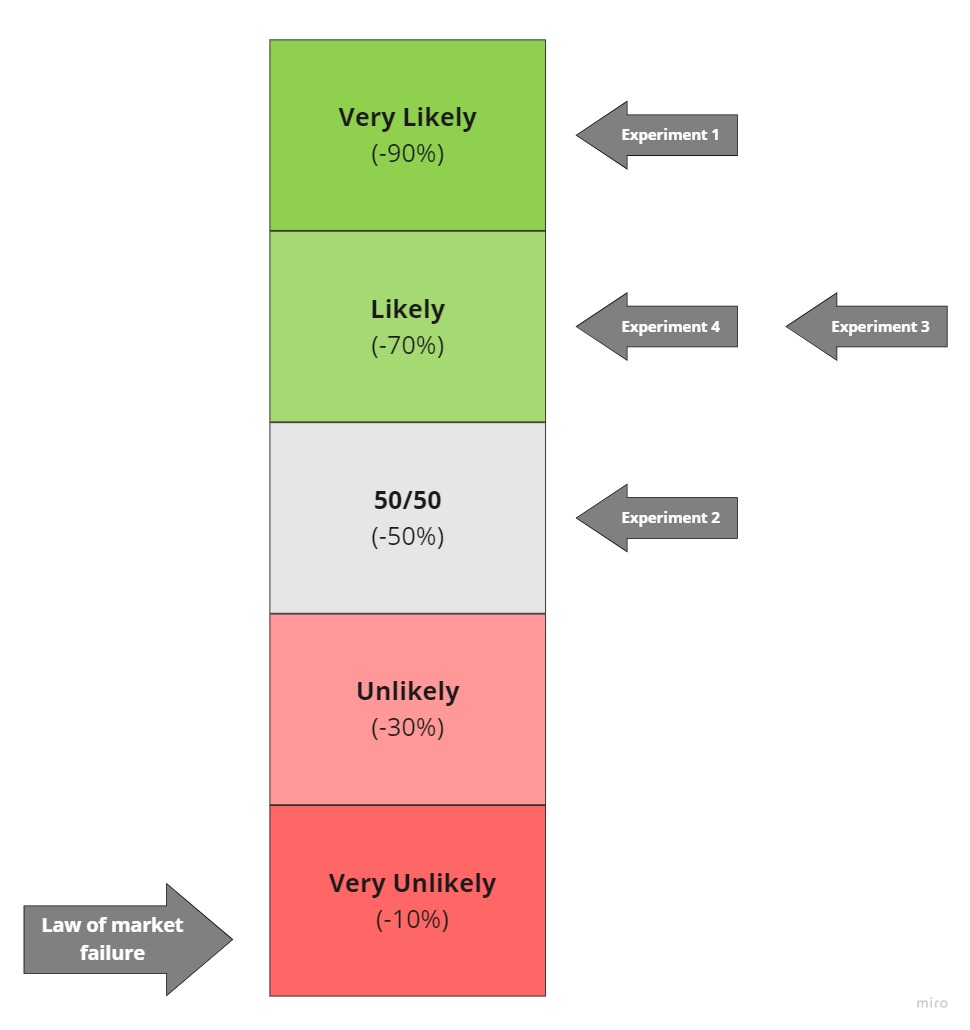
Put your EVIDENCE in the TRI (The Right it) Meter
(Taken from the right it by Alberto Savoia)
It’s a visual analysis tool that will help you interpret your evidence as objectively as possible.
It will also give you a rough estimate of how likely your idea will succeed in the market.
Here’s a guideline to help you map your data on the TRI Meter:
If your evidence significantly exceeds (2X) what the hypothesis predicts, chances are that your idea is Very likely (90%) to succeed in the market.
If your evidence slightly exceeds (1.5X) what the hypothesis predicts, chances are that your idea is Likely (70%) to succeed in the market.
If your evidence just meets the target (X-1.5X) of what the hypothesis predicts, chances are that your idea has 50-50 chance (50%) to succeed in the market.
If your evidence falls just short (<X) of what the hypothesis predicts, chances are that your idea is Unlikely (30%) to succeed in the market.
If your evidence significantly short (<0.5X) of what the hypothesis predicts, chances are that your idea is Very unlikely (10%) to succeed in the market.
Make a DECISION
On the basis of your gathered evidence, you will decide what your next ACTION will be.
Validated: If your hypothesis is validated with your experiment, you must move on to your next important hypothesis.
Invalidated: If your hypothesis is invalidated/refuted with your experiment, you must either pivot or find a new problem or test the same assumption with a new customer segment.
Inconclusive: If your hypothesis is inconclusive with your experiment, you must run another round of experiments to produce stronger evidence.
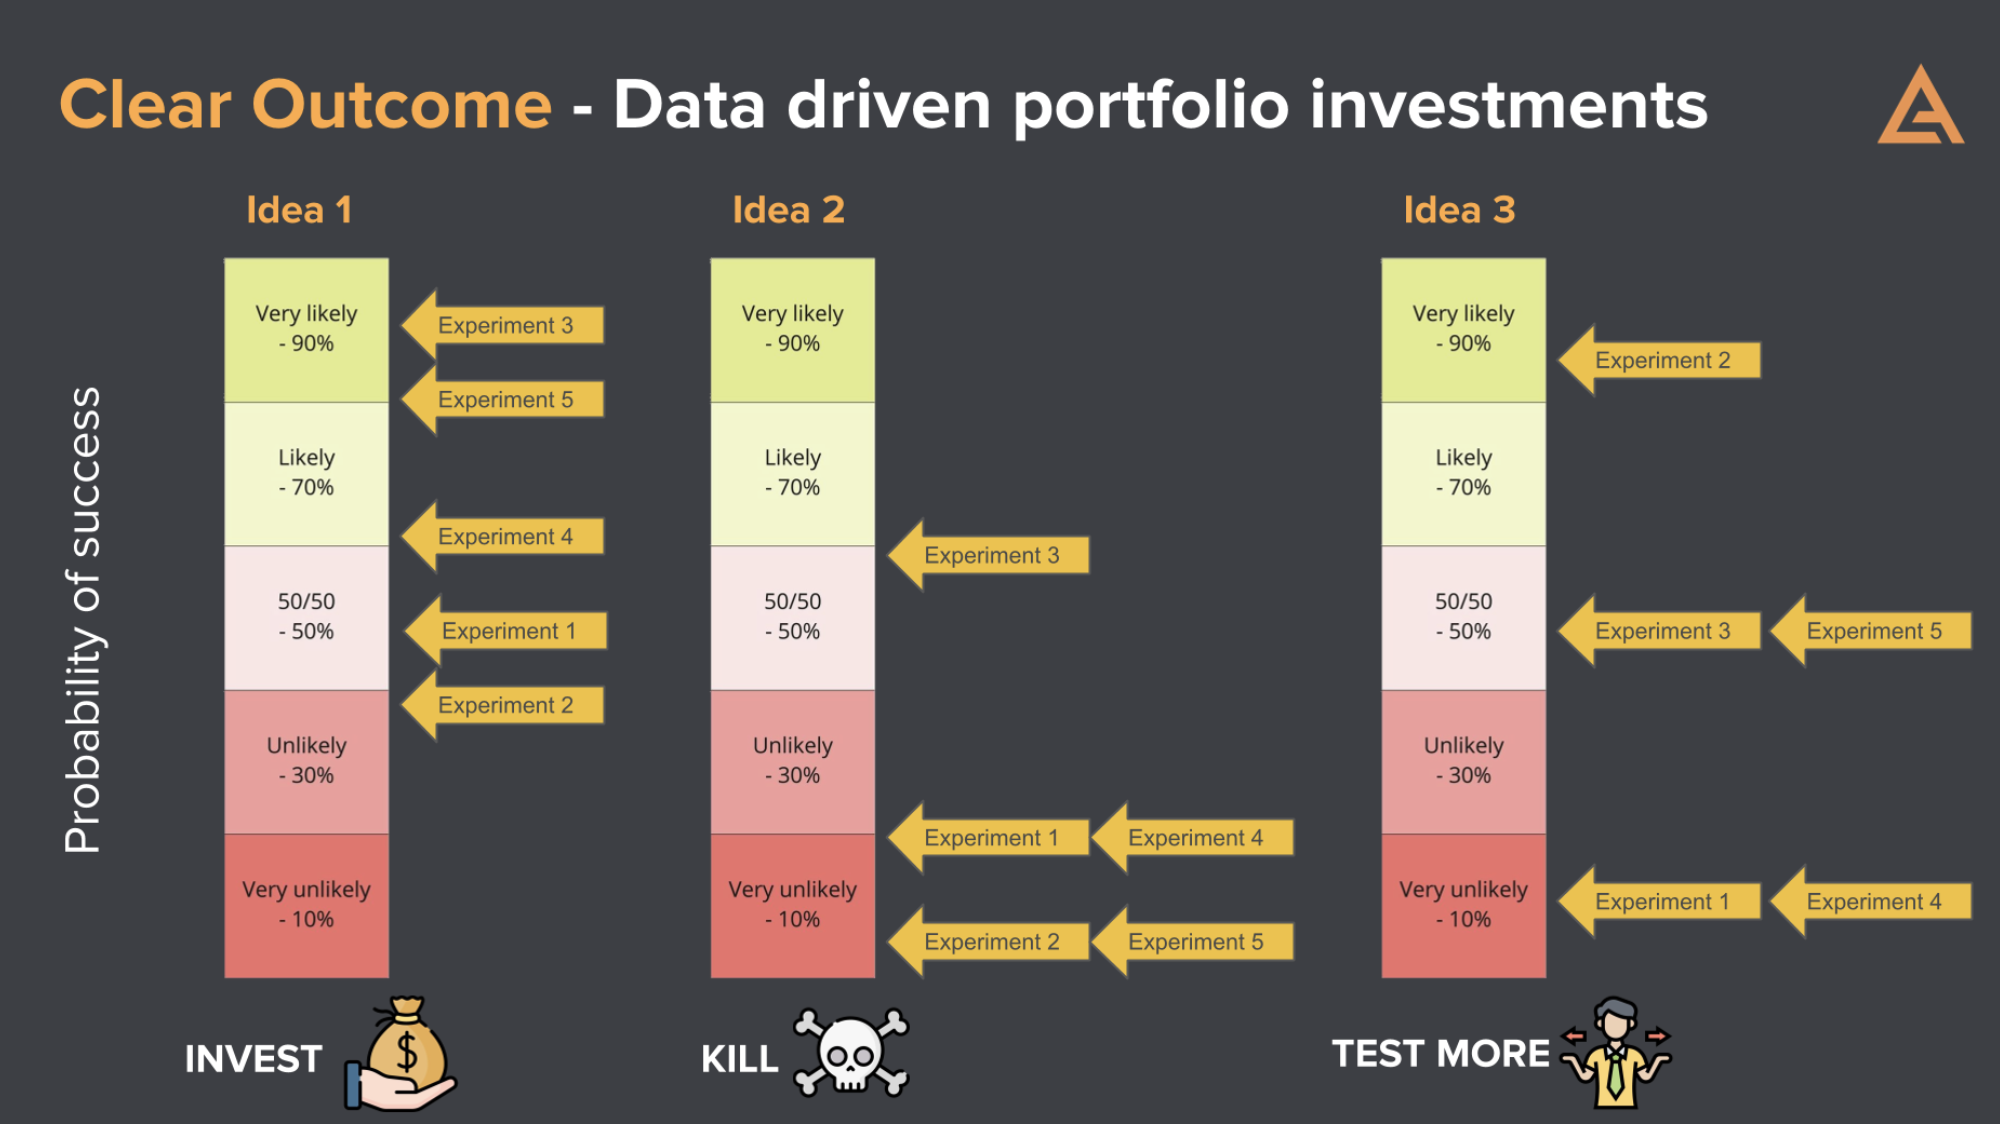
You must run 8-10 experiments to fully test all your assumptions in the problem, solution and business viability space. You have to mark each one of them on TRI meter and a pattern will start to emerge – with will help you decide
KILL VS INVEST VS GENERATE MORE DATA
Now run along and start experimenting 😉
